AI-driven prices, trends, and investment data for Barcelona
Market insights, price per m², rent ranges, and ROI analysis will appear once data verification is complete.
| Investment Amount | Monthly Return | Annual Return | ROI |
|---|---|---|---|
| €10,000 | €29 | €349 | 3.5% |
| €20,000 | €58 | €698 | 3.5% |
| €30,000 | €87 | €1,047 | 3.5% |
| €50,000 | €145 | €1,745 | 3.5% |
| €100,000 | €291 | €3,490 | 3.5% |
| €200,000 | €582 | €6,980 | 3.5% |
| Property Type | Avg Size | Average Price | Monthly Rent | Rental Yield |
|---|---|---|---|---|
| 4+ Bedroom Apartment | 120 m² | €200,200 | €1,388 | 8.3% |
| condos | - | €320,000 | €1,800 | 8.1% |
| Commercial | - | €320,000 | €1,800 | 8.1% |
| Land | - | €320,000 | €1,800 | 8.1% |
| apartments | 50 m² | €325,000 | €1,000 | 4.0% |
| Studio | 32 m² | €200,000 | €950 | 4.0% |
| 1 Bedroom Apartment | 50 m² | €325,000 | €1,150 | 3.8% |
| houses | 120 m² | €750,000 | €3,000 | 3.8% |
| apartments | 70 m² | €500,000 | €1,500 | 3.5% |
| 2 Bedroom Apartment | 75 m² | €525,000 | €1,675 | 3.5% |
| houses | 180 m² | €1,200,000 | €4,000 | 3.4% |
| apartments | 90 m² | €800,000 | €2,200 | 3.0% |
| 3 Bedroom Apartment | 100 m² | €825,000 | €2,500 | 3.0% |
| 4+ Bedroom Apartment | 150 m² | €1,500,000 | €4,000 | 2.5% |
| Townhouse | 130 m² | €900,000 | €3,250 | 2.2% |
| Penthouse | 200 m² | €1,500,000 | €6,750 | 2.0% |
| Villa | 300 m² | €3,000,000 | €8,500 | 1.8% |
| Metric | Current Value | YoY Change |
|---|---|---|
| Average Property Price | €320,000 | +6.5% |
| Average Monthly Rent | €1,800 | +4.8% |
| Rental Yield | 8.1% | +0.2% |
| Price per m² | €4,000 | +3.9% |
| Properties Sold YTD | 2,500 | +12.4% |
| Average Days on Market | 30 days | -8% |
Returns are calculated based on aggregated market data and do not represent guaranteed outcomes. Provided numbers is not an advice for investment.
Key insights into local investment infrastructure
Our top-performing properties selected by investment experts
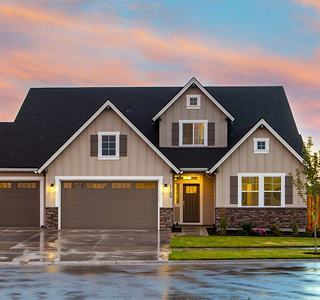